Published May 2026
From Silent Failures to Automated Alerting
After migrating a production WordPress site to the official AWS Lightsail WordPress blueprint, the site went down twice without any automatic warning. That changed how I thought about monitoring, stability and operational visibility.
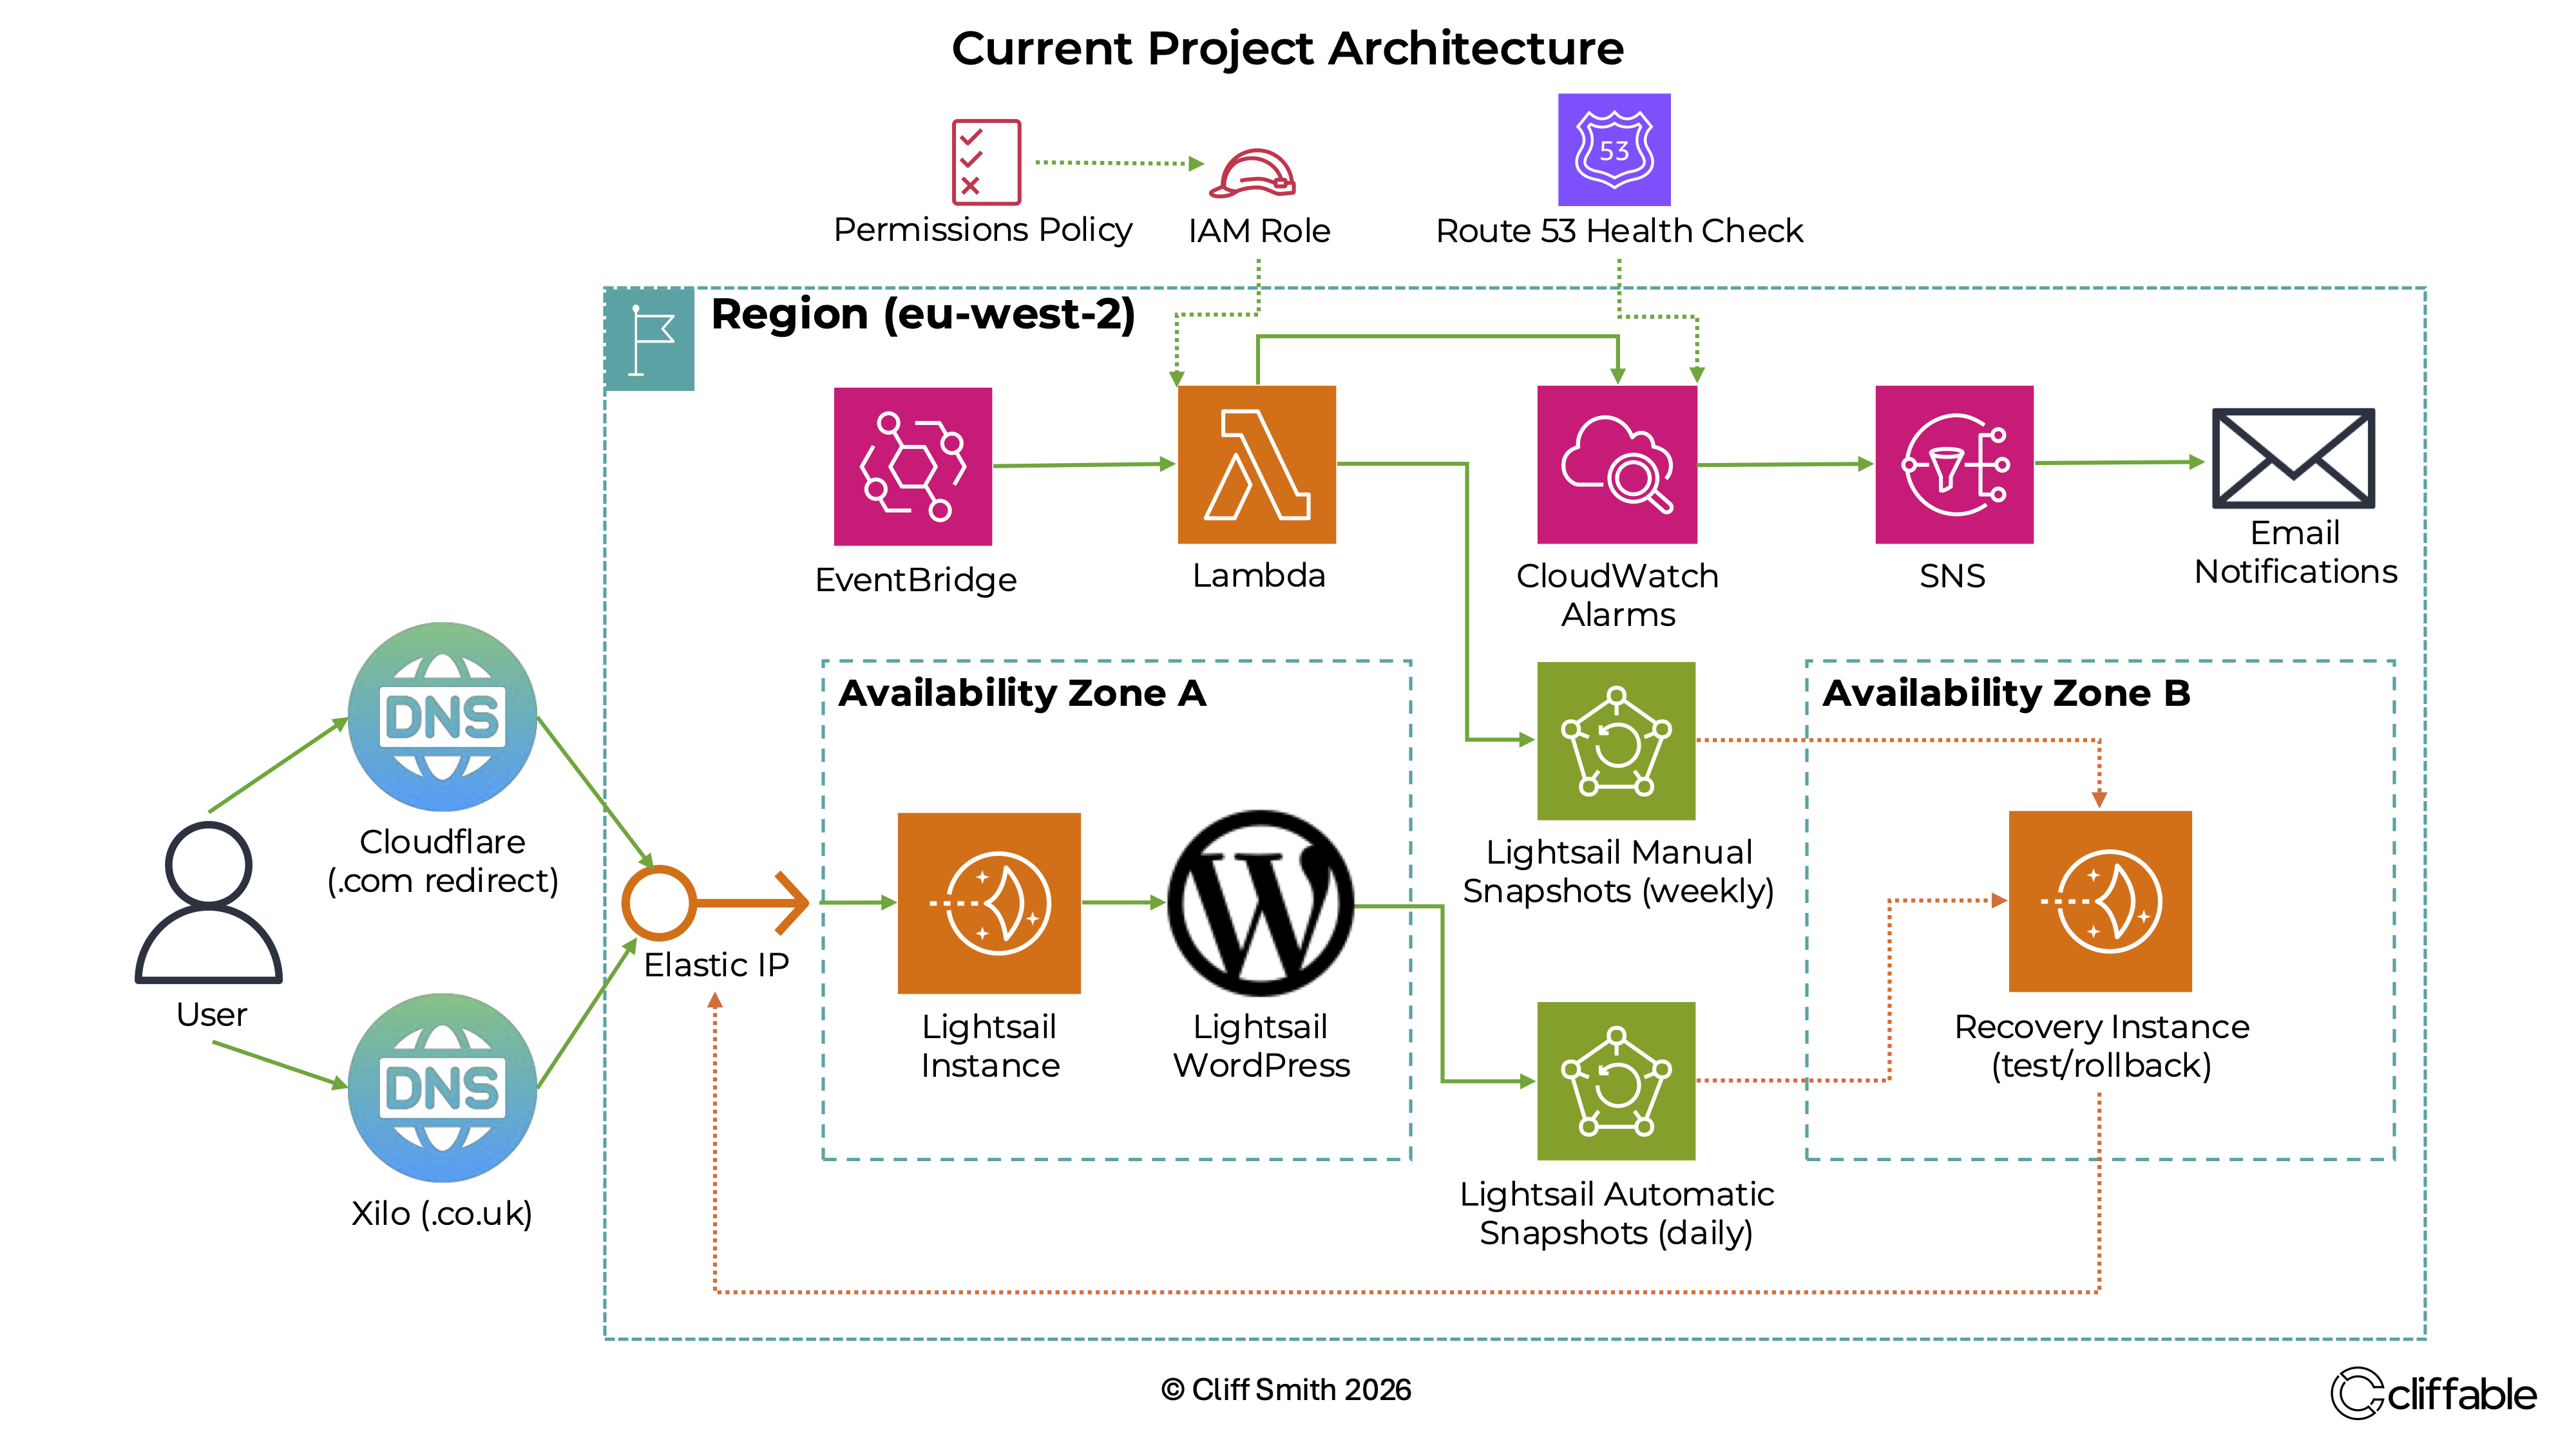
Production Lightsail WordPress architecture with Route 53 health checks, CloudWatch alarms, SNS notifications and snapshot-based recovery.
The problem with silent failures
After migrating the site from the deprecated Bitnami Lightsail WordPress blueprint to the official AWS Lightsail WordPress blueprint, the production site became intermittently unstable.
On two separate occasions, the site went down silently. I only noticed because I happened to check the website manually.
That was the real issue. The outage itself mattered, but the bigger operational problem was that the system had no reliable way to tell me something had failed.
Investigating the instability
The site was running on a 1 GB Lightsail instance with no swap configured. Investigation suggested that the failures were most likely caused by temporary memory pressure during WordPress, Apache or background maintenance activity.
A small production site can appear stable most of the time, but short bursts of activity can still exhaust available memory. Without swap, the instance had less room to absorb those temporary spikes.
To improve stability under memory pressure, I configured a persistent 1 GB swap file on the server.
Adding external monitoring and alerts
The next priority was visibility. I wanted the system to alert me automatically if the site went down again, rather than relying on chance discovery.
I implemented Route 53 HTTPS health checks for external uptime monitoring, then connected the health check status to CloudWatch alarms and SNS email notifications.
I also added Lightsail alarms for key instance-level signals, including CPU utilisation, burst capacity and status check failures.
- Route 53 HTTPS health checks monitor whether the public website is reachable
- CloudWatch alarms detect unhealthy states and metric thresholds
- SNS sends email notifications when alarms move into the ALARM state
- Lightsail alarms provide instance-level visibility into resource pressure and status failures
Testing the alerting path
I did not want to assume the alerts worked just because they were configured.
To validate the full monitoring path, I tested the setup using a real Apache outage. The site became unavailable, the health check failed, the CloudWatch alarm moved into the ALARM state, and SNS sent an email notification.
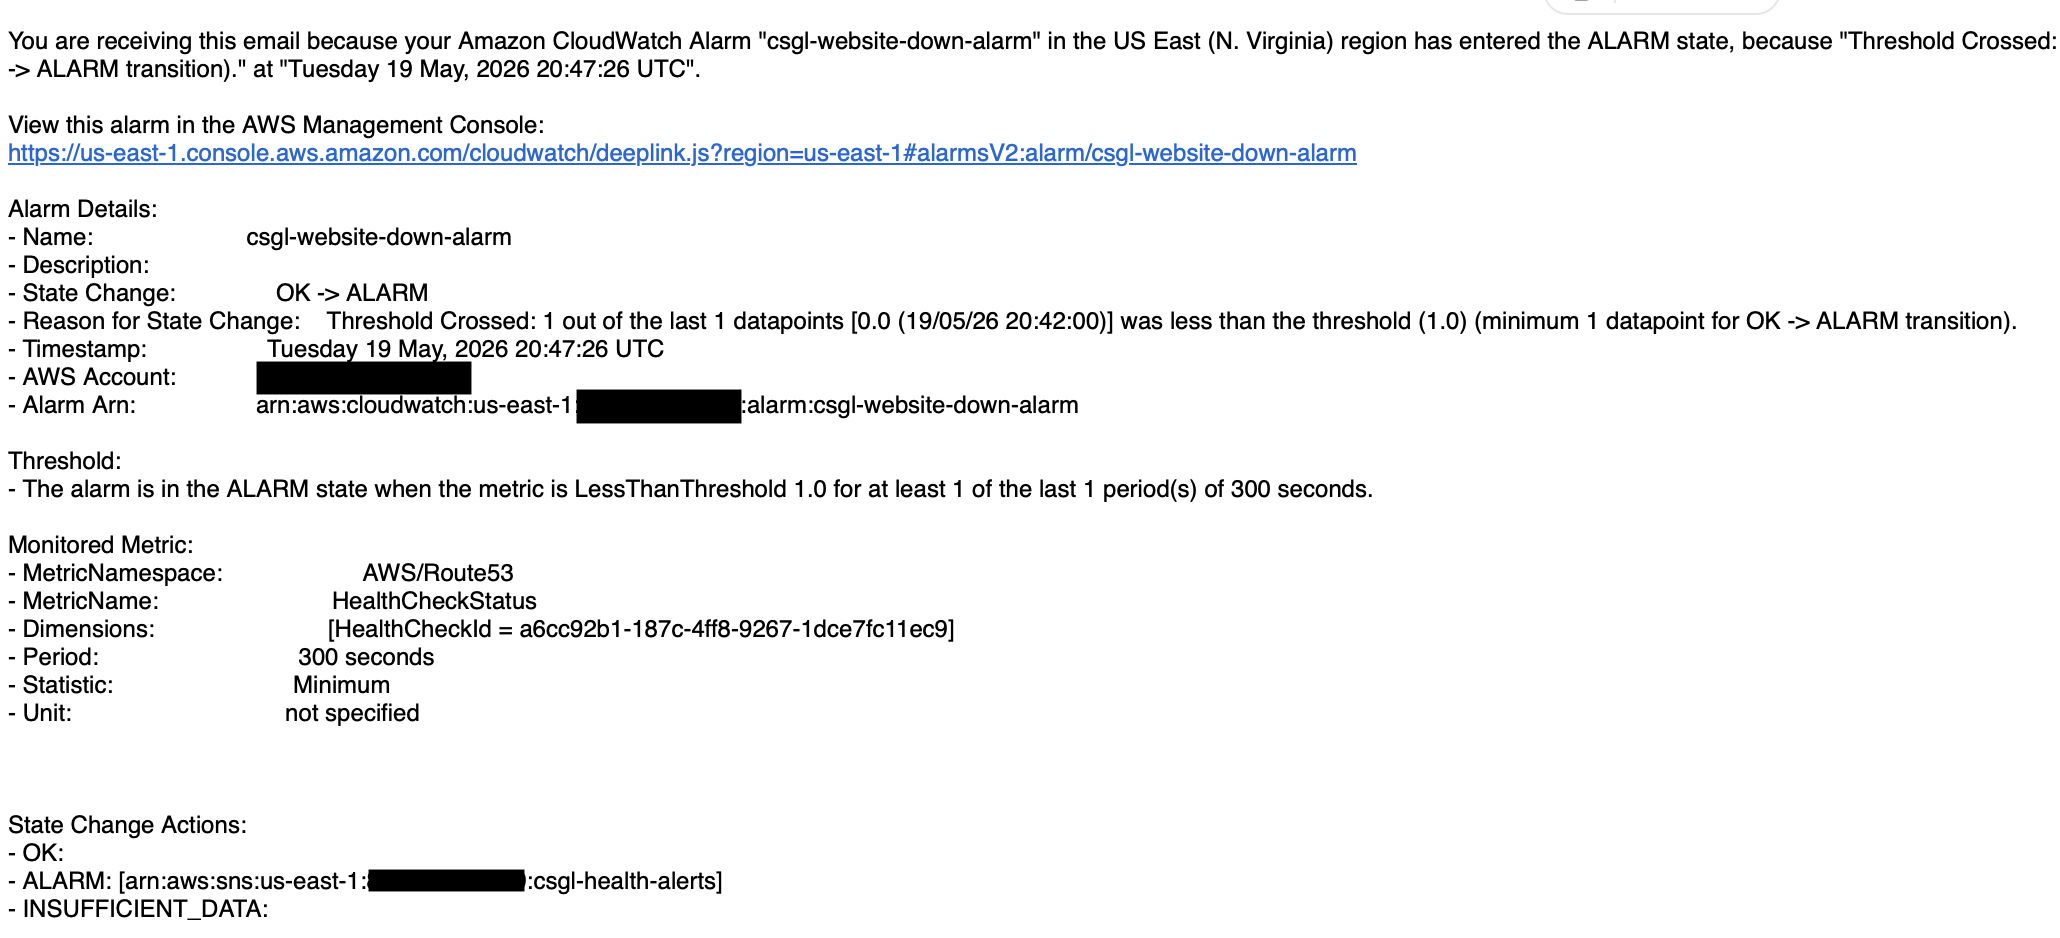
CloudWatch alarm email generated through SNS after validating the website-down alerting path.
That test was important because it confirmed the complete detection chain, not just the individual AWS resources.
What changed most
Before this work, production failures depended on me noticing them manually.
After adding health checks, alarms and email notifications, the system became capable of reporting failures automatically.
The main improvement was not just technical stability. It was operational awareness.
Conclusion
This was a useful reminder that keeping a production site online is not only about the server running successfully most of the time. It is also about knowing quickly when something has gone wrong.
Adding swap improved resilience under memory pressure, while Route 53 health checks, CloudWatch alarms, Lightsail alarms and SNS notifications improved visibility. The site moved from silent failure to monitored operation.
Related project
This work was implemented as part of the WordPress on AWS Lightsail project.